
Blockchain Data Audit Checklist for Web3 Teams

Vincent Charles
July 30, 2026 · 11 min read

TL;DR:
- A dashboard can match the chain exactly and still mislead the business.
- The technical checklist below is necessary and not sufficient. You can pass all of it and still measure the wrong things.
- The findings that change decisions are usually definitional, not technical.
A dashboard can match the chain and still mislead the business. A token transfer may be counted twice after a bridge. A proxy upgrade can change event behavior while the signature stays identical. A wallet-level metric can be presented as a user metric. That is why a blockchain data audit checklist has to test more than whether a query runs. It has to verify whether the data, the definitions, and the reporting logic support decisions a protocol can defend.
The cost of getting this wrong is not a bad chart. Product teams optimize for low-quality activity. Growth overstates acquisition. Finance and investor reporting carry inconsistent numbers. Compliance workflows miss material exposure.
This piece covers both halves of the problem. First the technical checklist, which is the part most guides stop at. Then the part that actually produces the findings worth paying for.
Set the boundary before you test anything
Document what is in scope. Name the chains, contracts, wallets, data vendors, warehouse tables, dashboards, reporting periods, and material KPIs. Include offchain inputs such as app events, CRM records, referral data, and pricing feeds wherever they touch a reported metric.
The standard should match the decision at stake. A protocol preparing board reporting needs tighter reconciliation and sign-off than a team reviewing an experimental feature. A compliance dataset prioritizes address coverage, historical reproducibility, and alert latency. A product analytics dataset prioritizes wallet identity rules, event completeness, and cohort consistency. The bar moves. Ambiguity never becomes acceptable.
The technical checklist
1. Source completeness and chain coverage
- Every relevant chain, contract address, deployment version, and historical start date is represented.
- Legacy deployments, sidechain instances, staking modules, and router contracts are included, not silently dropped. Auditing the primary contract and missing the router is the most common version of this failure.
- The ingestion method is documented: blocks, traces, receipts, logs, decoded events, or a vendor's enriched tables.
- The pipeline backfills missed ranges, and an alert fires when a job fails or a provider falls behind. A successful scheduled run is not proof that all expected blocks arrived.
- Finality policy is stated explicitly. Head blocks, a confirmation threshold, or finalized blocks. Provisional data can be right for operational metrics and is usually wrong for monthly financial reporting.
- Reorged transactions are removed or clearly marked, never silently retained.
2. Contract decoding and protocol semantics
- A sample of high-value and edge-case transactions is checked against a block explorer or raw logs.
- Event names, indexed parameters, token decimals, sender and recipient fields, and the mapping from a router transaction to its underlying protocol action all validate.
- Proxy contracts have a version-aware registry with effective dates. An event signature can survive an upgrade while its business meaning changes underneath. Treat protocol upgrades as data-change events, not just engineering milestones.
- Bridge flows have a stated convention. A deposit on the origin chain and a mint on the destination are one flow, not two users and not two units of new volume. Gross, net, or a separate bridge metric are all defensible. Switching between them silently is not.
3. Balances, flows, and financial metrics
- Value metrics reconcile at least one level below the dashboard. Aggregate transfers by token and period, then compare against protocol-level accounting or known balance changes.
- TVL, volume, fees, revenue, rewards, and outstanding debt each trace to a reproducible calculation. If they do not, they are not ready for executive use.
- Price logic is recorded: source, timestamp convention, quote currency, fallback behavior, treatment of illiquid assets. Daily close, transaction-time price, and hourly average produce materially different USD volume. The problem is not picking the wrong one. The problem is not stating which one.
- Realized fees are separated from accrued fees, protocol revenue from gross fees, and token emissions from rewards actually claimed.
4. Wallet identity and entity attribution
- Every place the reporting layer turns addresses into users, accounts, institutions, or acquisition channels is identified.
- Clustering rules, known-address labels, exchange and contract exclusions, and the handling of smart wallets, multisigs, and account abstraction wallets are all visible and documented.
- The unit is defined precisely: unique active address, connected wallet, verified account, or entity cluster.
- The same definition is used across acquisition, activation, retention, and revenue. A retention chart built on connected wallets cannot be compared with an acquisition chart built on raw addresses.
Wallets are addresses, not people. One person may run several. Thousands of deposit addresses may belong to a single exchange. Onchain data alone will never resolve this perfectly, which is exactly why the assumptions have to be written down rather than buried in a CTE.
5. Transformations and metric definitions
- Joins that can multiply rows, filters that exclude a contract version, deduplication keys, timezone conversions, null handling, and incremental-load logic are all reviewed.
- Row counts and key aggregates are compared before and after each material model.
- Every headline KPI has a metric contract: business definition, numerator, denominator, source tables, update cadence, owner, exclusions, known limitations.
- Anomaly checks run around known events. Launches, airdrops, incentive changes, contract upgrades, outages, and major market moves surface hidden logic failures faster than any random sample.
6. Dashboards, access, and evidence
- Filters behave as intended, labels match the metric contracts, totals reconcile across tabs, and date ranges default to sensible periods.
- Edit rights on source queries, semantic models, and production dashboards are known. Production data has named owners, documented change approval, and recoverable version history.
- Sensitive labels, user data, and compliance findings sit behind role-based access with retention rules.
- Evidence is stored: query outputs, transaction samples, reconciliation files, failed tests, remediation tickets, final sign-off. This is what you produce when a board member or a partner asks how a number was built, eight months later.
Where this checklist stops being enough
Everything above is real work and worth doing. It is also the easy half.
A team can pass every item on that list and still have a reporting layer that does not help anyone. The queries decode correctly. The reconciliation ties out. The dashboards load. And nobody opens them, because not one of those checks asks whether the metric is the right metric.
That is the gap I keep finding. The technical layer answers "is this number correct." The expensive question is "is this the number that should be on the screen." No amount of query validation gets you there.
The findings that actually change what a team does are almost always definitional rather than technical.
What a strategy audit adds
This is where I spend most of an engagement, and it is a different discipline from data engineering QA. The approach is Web2 practice applied to crypto and DeFi reality: methods that are mature in SaaS, adapted for wallets, tokens, and incentives, which is a combination that is still rare in this market.
Definitions harmonization. Before you optimize anything, four teams need one definition of an active user. This sounds trivial and it is the single most common finding. Growth, product, finance, and leadership each carry their own version, all defensible in isolation, and none of them reconcile in a board meeting. Fixing this is unglamorous and it unblocks everything downstream.
Objectives before metrics. Most crypto dashboards are built bottom-up from whatever was queryable, then retrofitted with a narrative. The order should be inverted: business objectives, then the metrics that evidence them, then the pipelines that produce those metrics. We write about the mechanics of this in Web3 OKRs, and it is the OKR strategy layer of the audit.
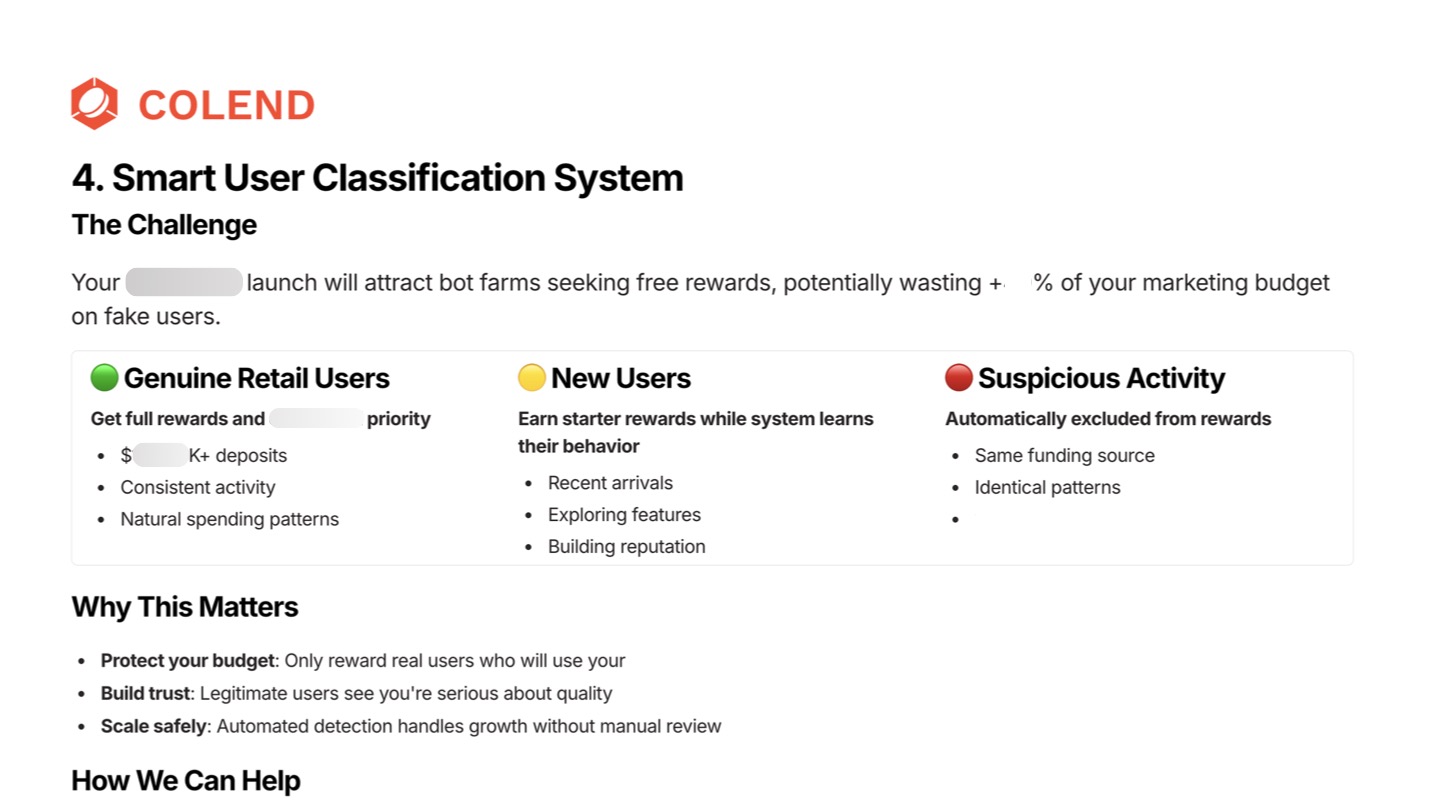
Segmentation that does more than count. The technical checklist treats wallet identity as an accuracy problem: are you double counting. The strategic version treats it as an intelligence problem.
Deanonymization and entity resolution tell you who your users actually are. Concentration analysis tells you what share of TVL or volume sits with a handful of entities, which is simultaneously a risk finding and a target list. If a meaningful portion of your protocol depends on a small number of identifiable counterparties, that belongs in your risk register and in your BD pipeline at the same time. Most teams do this by hand, occasionally, when someone remembers. Building automated detection into the stack turns it into a standing capability instead of a one-off exercise.
Conversion, not just activity. Wallet connect to first transaction is a funnel, and it responds to the same optimization work as any other funnel. Most protocols have never instrumented it. They measure what happened onchain and stay blind to everything that happened before the transaction, which is where nearly all the drop-off lives.
Acquisition channels nobody is auditing. Organic search and AI search are underexploited across almost all of crypto, because the space defaults to paid, KOLs, and Twitter. Assessing that gap belongs in a data audit, since it is a measurement question before it is a marketing one.
Vendor-agnostic recommendations. We do not have a preferred stack to sell you. Recommendations are scoped to your stage, your budget, and the setup you already have, which sometimes means keeping the tool you have and fixing how it is used.
What this looks like in practice
One engagement stands out as the clearest example of why the technical layer is insufficient.
A lending protocol had roughly 200 daily active users, almost entirely institutional, and was weeks away from launching a retail-facing product. Their dashboards were fine. Numbers reconciled. Nothing on the technical checklist would have flagged a problem.
The central finding of the audit was that their existing user base was structurally wrong for the product they were about to ship. Whales do not adopt a daily-spend consumer product. The users they had were not the users the new product needed, and every acquisition assumption in the launch plan was built on the wrong segment.
That finding came from segmentation and business context, not from query validation. It changed the launch plan. No technical audit would have surfaced it, because technically nothing was broken.
Turn findings into an operating plan
An audit only matters if it changes the operating model.
Classify issues by decision risk and effort. A mislabeled chart is low risk. Missing events from a revenue-bearing contract, or double-counted bridged volume in an investor update, is not. Give every issue an owner, a target date, and a validation test that proves the fix landed.
Then put controls where the errors originate. Contract registries, automated freshness checks, schema-change alerts, reconciliation tests, and metric contracts living alongside the code. Set a review cadence: lightweight checks after deployments and campaign launches, a fuller review before material reporting cycles.
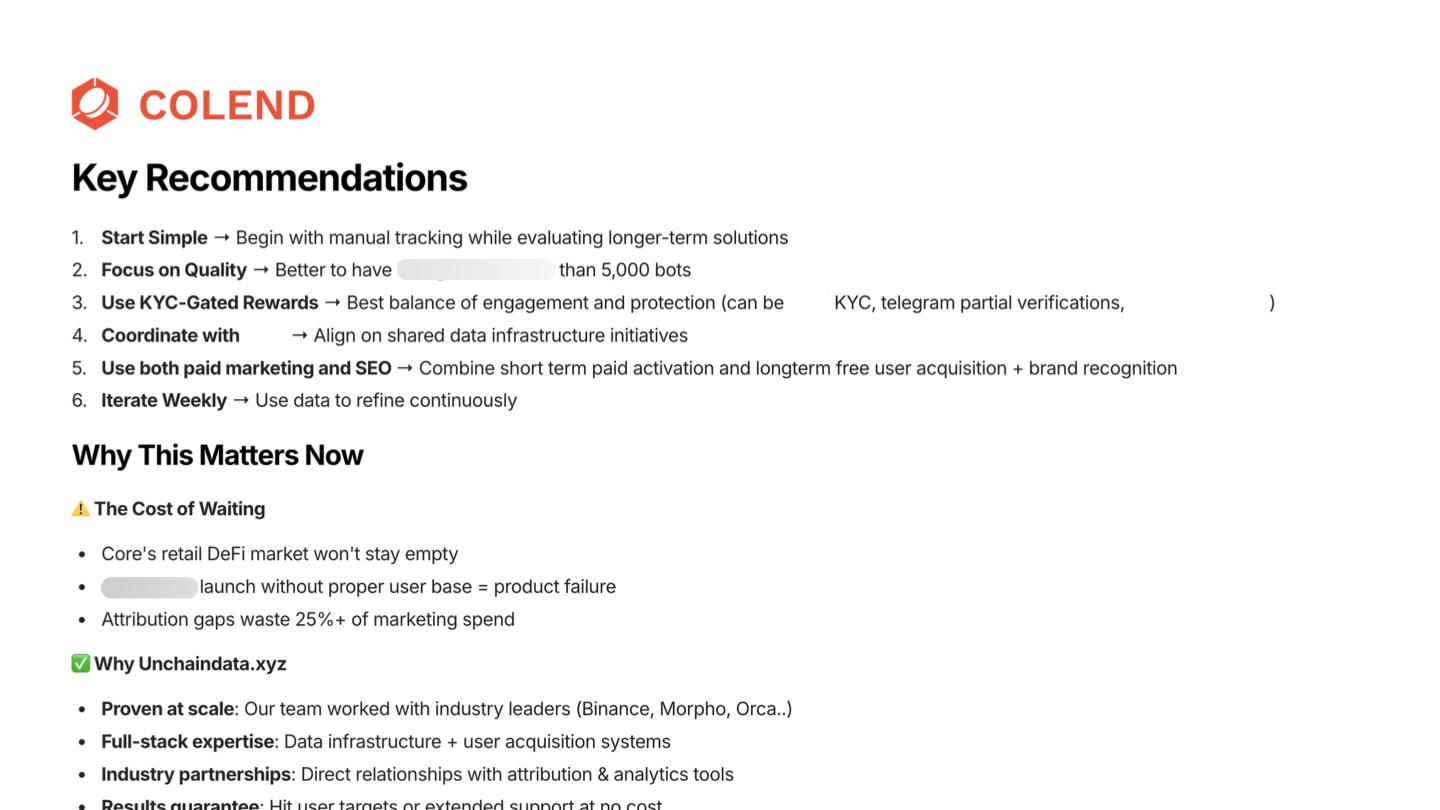
A good audit does not promise perfect attribution or permanent definitions. Protocols change, users move across chains, vendors revise coverage. The value is narrower and more durable: every critical number has a known lineage, a stated limitation, and an accountable owner. And the numbers on the screen are the ones the business actually needs.
If you want the strategic half done properly, that is what our Web3 data strategy audit is. $2,500, delivered in one week, covering current state, KPI and OKR design, segmentation, attribution, and a prioritized roadmap you can hand to your team or to us.
Key Takeaways
- Set the audit boundary first. Chains, contracts, vendors, tables, dashboards, reporting periods, and the offchain inputs that touch reported metrics.
- Reorg and finality policy should differ between operational dashboards and financial reporting. State which you are using.
- Proxy upgrades change meaning while keeping event signatures. Keep a version-aware contract registry with effective dates.
- Bridge flows are one movement, not two users. Pick gross, net, or a separate metric, then stay consistent.
- Every headline KPI needs a metric contract: definition, numerator, denominator, sources, cadence, owner, exclusions, limitations.
- Passing the whole technical checklist does not mean your reporting is useful. Correct and irrelevant is a real state.
- The findings that change decisions are usually definitional. Four teams with four definitions of an active user is the most common one.
- Concentration analysis is a risk finding and a BD target list at the same time. Automate it rather than running it manually once a quarter.
- Founder of Unchain Data
- Former data lead at Morpho Labs and Binance
- Builds Dune dashboards and data pipelines across Ethereum, Solana and Sui
- Advises VC funds and DeFi protocols on data strategy
- Featured on BBC for blockchain data research
Ready to practice what you just read?
WizardCamp has interactive SQL exercises on real blockchain data. Write queries, get instant feedback, earn certificates.
Explore WizardCamp