
How to Build a Dune Dashboard for Your DeFi Protocol

Vincent Charles
August 14, 2026 · 13 min read

TL;DR
-
Building a useful protocol dashboard is a measurement-design and verification problem, not a SQL problem.
-
The step most teams skip is the one that makes the dashboard trustworthy: reconciling your independently computed numbers against the protocol's own published figures before you show the dashboard to anyone.
Your protocol has a DefiLlama page, an analytics tab on your frontend, and maybe a community dashboard someone built on Dune last year. None of them agree on TVL. If you have ever pulled up three numbers for the same metric and gotten three different answers, this post is for you.
I build Dune dashboards for DeFi protocols. The ones that track TVL, volume, user retention, and revenue from the protocol's own on-chain events. Not the kind where you copy a query from a tutorial and change the contract address. The kind where you verify every number against the protocol's frontend before you show it to anyone, because wrong numbers in a dashboard are worse than no dashboard at all.
This is what that process actually looks like.
Start with contract verification, not queries
The most common mistake in protocol analytics is querying the wrong contract.
The most-cited "Navi Protocol" dashboard on Dune, built by a respected analytics team, had 19 charts and thousands of views. It was querying Suilend's event package, not Navi's. Every number on that dashboard was accurate SQL against the wrong protocol entirely.
This happens because protocol contract addresses change across package upgrades, multiple packages emit events for different features, and address directories go stale. On Sui, a single protocol can have three or four active packages. On Ethereum, proxy contracts and protocol upgrades create similar confusion.
Before you write a single query, verify your contract addresses:
- Get the canonical addresses from the protocol's own documentation or GitHub, not from a directory or someone else's dashboard.
- Run an event discovery query to confirm the address emits the events you expect.
- Cross-check against a block explorer. On Sui, check the package on SuiVision or Suiscan. On Ethereum, check the implementation behind any proxy on Etherscan. Solscan on Solana etc.
-- Verified: runs on Dune as of Aug 2026. Replace the package address
-- with your protocol's. The date filter uses the partition column.
-- Event discovery: what does this contract actually emit?
SELECT
    event_type,
    COUNT(*) AS event_count,
    MIN(date) AS first_seen,
    MAX(date) AS last_seen
FROM sui.events
WHERE package = 0x[YOUR_PACKAGE_ADDRESS]
    AND date >= CURRENT_DATE - INTERVAL '30' DAY
GROUP BY event_type
ORDER BY event_count DESC
If the event types don't match what the protocol's docs describe, you have the wrong address. Stop and fix that before building anything.
Build around a metric hierarchy, not a chart collection
A dashboard with 40 charts can still leave a founder asking "so what changed?" The failure mode is not missing data. It is missing structure. A protocol dashboard that matters to operators organizes metrics into layers: top-level outcomes that answer "are we healthy?", diagnostic indicators that explain why a number moved, and drill-down detail that lets someone investigate.
For the protocols I work with, the top-level outcomes are almost always the same four: TVL, volume, user retention, and revenue. Everything else is either a diagnostic that explains movement in those four, or detail that supports investigation. Organizing this way keeps the dashboard from becoming a chart repository where every stakeholder's wish list gets its own tile.
TVL: harder than it looks
TVL is the metric everyone wants and almost everyone gets wrong. The problem is not the SQL. The problem is that TVL requires you to combine balances across multiple pools or reserves, price them in USD, and handle edge cases like deprecated components, bridged token decimals, and stale price feeds.
On chains with good Spellbook coverage (Ethereum, Arbitrum, Base), you can start with curated tables like dex.trades or protocol-specific decoded tables. On chains like Sui, where there are no decoded per-protocol tables, you compute TVL from raw event data or object state replays, priced from the protocol's own on-chain oracle.
The raw-events approach works like this: instead of relying on a pre-built table, you query the protocol's reserve state over time, extract the supply and borrow fields, apply the protocol's own scaling (interest rate indices, decimal normalization), and price it using on-chain oracle values.
This is more work than joining a Spellbook table. It is also the only way to get numbers you can defend when someone asks "where did this come from?" The answer is: from the protocol's own state, priced by the protocol's own oracle, with no intermediary.
-- Schematic: concept illustration only. Real implementation requires
-- protocol-specific JSON paths, decimal handling, and index multiplication.
-- Do not copy-paste. See the verification section for how to prove it correct.
SELECT
    date,
    reserve_symbol,
    (raw_supply / power(10, decimals)) * oracle_price_usd AS supply_usd
FROM protocol_reserve_daily_snapshot
-- This is a materialized view you build, not a table that exists.
A real implementation for a lending protocol on Sui involves parsing reserve objects, applying interest rate index multiplication (a 1e27-scaled accumulator, similar to Aave's liquidityIndex), and joining to an on-chain price oracle. The details are protocol-specific. The principle is universal: reconstruct from the protocol's own state, not from an aggregator's interpretation of it.
Volume
Volume is more straightforward if a curated table covers your protocol. On Ethereum, dex.trades handles most DEXs. On Sui, dex_sui.trades covers nine DEXs (verified Aug 2026: Cetus, Bluefin, DeepBook, Momentum, Aftermath, FlowX, Kriya, Obric, BlueMove). Check whether your protocol is included before building from scratch.
If it is not, or if you need granularity the curated table does not provide (pool-level breakdown, maker vs taker, fee tiers), you build from the protocol's swap events directly.
User retention
Retention is the metric most protocol dashboards skip entirely, and it is the one that tells you whether your product actually works. A retention cohort query groups users by the week they first interacted with your protocol, then tracks what percentage of each cohort returned in subsequent weeks.
-- Verified: this pattern runs on Dune (tested against dex.trades for
-- Uniswap V3 Ethereum, Aug 2026). Adapt the table and column names
-- to your protocol's events.
WITH first_touch AS (
    SELECT
        user_address,
        DATE_TRUNC('week', MIN(block_time)) AS cohort_week
    FROM your_protocol_events
    GROUP BY user_address
),
activity AS (
    SELECT
        user_address,
        DATE_TRUNC('week', block_time) AS active_week
    FROM your_protocol_events
    GROUP BY 1, 2
)
SELECT
    f.cohort_week,
    a.active_week,
    COUNT(DISTINCT a.user_address) AS active_users,
    COUNT(DISTINCT a.user_address) * 1.0
        / MAX(cohort_size.cnt) AS retention_rate
FROM first_touch f
JOIN activity a ON f.user_address = a.user_address
JOIN (
    SELECT cohort_week, COUNT(*) AS cnt
    FROM first_touch GROUP BY 1
) cohort_size ON f.cohort_week = cohort_size.cohort_week
GROUP BY 1, 2
ORDER BY 1, 2
Retention is where on-chain analytics and product analytics meet. I worked on a migration feature at Morpho where on-chain data said "$38M migrated, feature works." Product analytics said "near-zero frontend engagement on the migration button." The truth was a dark button on a gray background making the CTA invisible. Combining both data sources found the problem. After the fix, Ethereum migrations grew 433% and total migrated crossed $86M.
On-chain data alone told the wrong story. A protocol dashboard that only tracks TVL and volume would never have caught that.
Revenue
Protocol revenue is protocol-specific: trading fees, interest spreads, liquidation penalties, mint fees. The common pattern is to identify the fee accrual events, extract the fee amount, price it, and aggregate. Most protocols emit a specific event when fees are collected or allocated to a treasury address.
Layering the hierarchy in practice
Once you have the four core metrics, organize the dashboard in layers:
Top-level outcomes. Three to six tiles at the top of the page. TVL, volume, active users, revenue, retained users. Each one should answer its question immediately, with a comparison to a meaningful prior period. If an operator has to scroll before understanding whether the protocol is healthy, the structure is wrong.
Diagnostic trends. Below the top line, show the movements that explain changes. If net deposits fell, is it fewer depositors, lower average size, more withdrawals, or a single large wallet? If active wallets grew, did new users return after seven days or thirty? These diagnostic charts convert a dashboard from reporting into analysis.
Segmented breakdowns. Chain, asset, pool, vault, user cohort, wallet size band. Segmentation is powerful when it connects to a decision ("which pool is losing LPs?"). It is noise when the column exists just because the data is available.
Investigation tables. Recent activity, large-wallet movement, anomalous transactions. The rows someone pulls up when a diagnostic chart shows something unexpected.
This hierarchy is what separates a dashboard that gets checked weekly from one that gets bookmarked and forgotten.
Reconciliation: proving your numbers
Building a dashboard is half the job. Proving it is correct is the other half, and most people skip it.
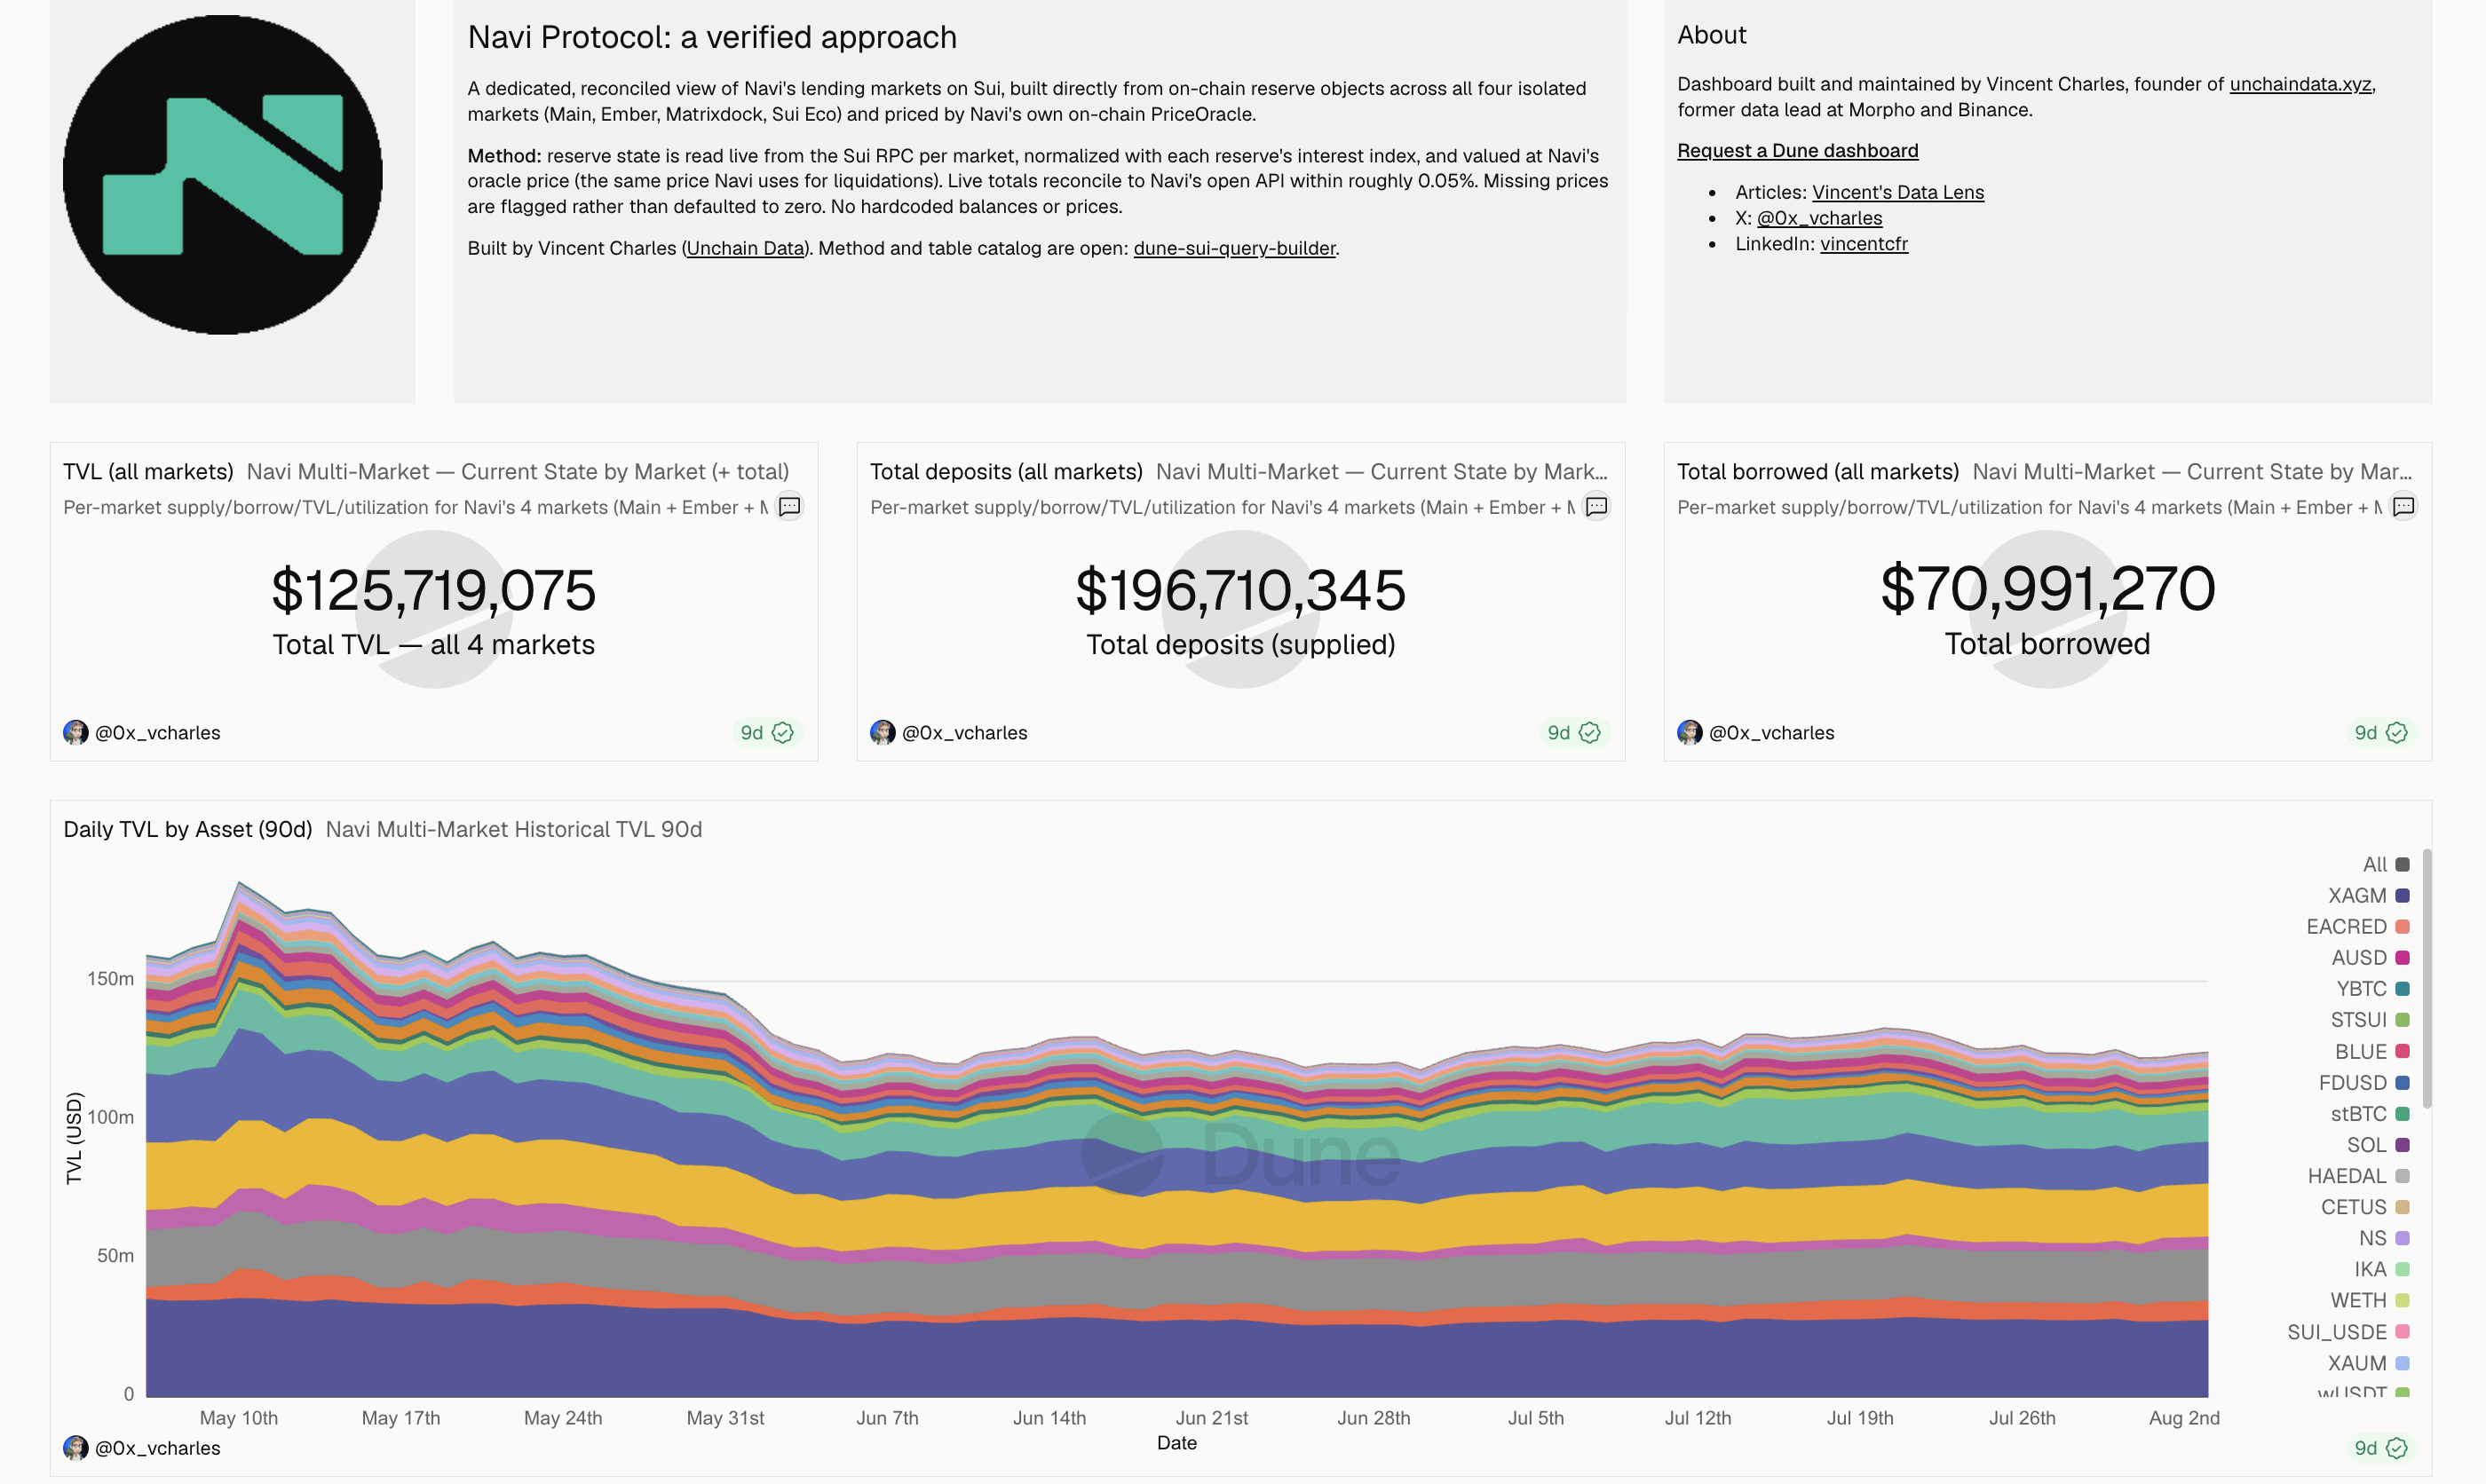
The test is simple: can your dashboard reproduce a number the protocol already publishes? Their frontend TVL, their total supply of a native asset, their cumulative volume. If your independently computed number matches theirs within a tight margin, your pipeline is sound. If it does not, you have a bug, and you know it before anyone else sees it.
I rebuilt the USDB stablecoin total supply for Bucket Protocol on Sui entirely from the protocol's own on-chain events on Dune. The number landed within $60 of what their frontend showed.
Sixty dollars off on a supply in the tens of millions. That margin is the proof that the pipeline handles decimals, event types, and scaling correctly end to end.
If your numbers do not reconcile, here is where to look:
Decimal scaling. The single most common source of wrong numbers. USDC has 6 decimals, DAI has 18, and on Sui, protocols normalize everything to 9-decimal precision internally before applying a separate interest rate index. Miss any of these and your TVL is off by orders of magnitude.
Missing event types. Protocols upgrade their contracts. On Sui, protocols can have three distinct packages emitting events across different eras. Scallop had 113,000 events from packages that the published "protocol address" list did not include. If you only query the address from the docs, you lose the events from the packages the docs forgot to mention.
Deprecated components in aggregator numbers. Bucket Protocol's DefiLlama TVL included a deprecated Farm component showing $38M when the actual Farm page read $0. The headline number was inflated by a ghost. Decompose aggregator numbers before trusting them.
A verification checklist
Once your dashboard is built, run these checks before sharing it:
Raw-events recount. Re-count the underlying events with no pricing and no joins. Compare the counts to your priced output. They must match exactly, not approximately. A mismatch means your joins dropped or duplicated rows.
Stablecoin face-value cross-check. For stablecoin-denominated amounts, the protocol's USD figure should match the raw token amount within a tight band (under 0.1%). A dollar stablecoin is worth about a dollar. If the band is wider, your decimal handling is wrong.
Reproduce a documented constant. Pick a number the protocol's docs state and reproduce it from raw events across full history. If the protocol says 30% of liquidation premiums go to an insurance fund, your data should show 30.000%. A mis-scaled or mis-signed pipeline cannot hit the documented constant.
Coverage invariant. For any daily state replay, compare expected cell count (days times objects) against actual. A shortfall means quiet objects that stopped emitting on some days, and your daily figures silently carry stale values forward.
Treat the dashboard as infrastructure, not a deliverable
A dashboard is not finished when it looks right on the day you ship it. It is finished when the team knows whether it is current, who owns it, how it is validated, and what happens when a number moves.
I have seen this go wrong enough times to know: the hardest part is not building the first version. It is keeping it accurate through contract upgrades, chain migrations, new pool types, and Dune platform changes. A dashboard that was correct in April is silently wrong by July if nobody owns its maintenance.
Three things make the difference:
A refresh cadence that matches decisions. A treasury dashboard needs daily refreshes. A quarterly governance dashboard does not. Faster is not always better if expensive queries fail, data arrives late, or the team does not act on intraday movement. Match the refresh to the operating rhythm it serves.
A documented owner and review date. Protocols move fast, and dashboards decay through no fault of the original builder. New contracts get deployed, event schemas change, features move to another chain, incentive programs alter user behavior. A quarterly metric review catches definition drift before it becomes institutionalized.
Integration into decisions, not just reporting. The strongest dashboards become part of an operating habit. Put it in the meeting where decisions are made. Assign follow-ups when a KPI moves. Revise the metric definitions when the business question changes. That is when on-chain analytics stops being an artifact and starts being infrastructure.
For teams without a dedicated data function, this is where the maintenance burden makes DIY stop scaling. The signals: your numbers disagree with your frontend and nobody on the team knows why; you have a community dashboard with thousands of views that you have never verified; you need retention, revenue, or reconciliation and only have TVL; you are spending engineering hours on data plumbing instead of protocol development.
That is what Unchain Data does for protocols: build and maintain production Dune dashboards with reconciliation built in, so the numbers are independently verifiable from day one.
Further reading
If you are new to Dune and SQL, start with the basics before building a protocol dashboard:
-
JW_Seoul's Non-Coder's Dune Guide (Part 1, Part 2): Zero-to-one SQL lessons covering
erc20_ethereum.evt_Transfer, token decimals, and the"from"/"to"quoting pattern. Good foundation. Note: Quest 1's sample query (Dune #6552453) currently times out and needs a time filter to run. -
Andrew Hong / Crypto Data Bytes (cryptodatabytes.com): One of the best resources for understanding the Web3 data landscape. His ecosystem overviews and chain-specific data guides are a strong starting point for any chain you want to analyze.
-
Dune Analytics official tutorials (YouTube playlist): Platform navigation, DuneSQL syntax, visualization basics.
-
Unchain Data /learn (unchaindata.xyz/learn): Curated learning resources including Ethereum, Solana, Sui, and Bitcoin data guides, plus data engineering fundamentals.
For Sui-specific on-chain analytics, the Sui Data 101 series covers bytes decoding, lending protocol analytics, and risk analysis patterns.
Vincent Charles is the founder of Unchain Data and former data lead at Morpho and Binance. He builds Dune dashboards for DeFi protocols and runs the crypto data job board.
- Founder of Unchain Data
- Former data lead at Morpho Labs and Binance
- Builds Dune dashboards and data pipelines across Ethereum, Solana and Sui
- Advises VC funds and DeFi protocols on data strategy
- Featured on BBC for blockchain data research
Ready to practice what you just read?
WizardCamp has interactive SQL exercises on real blockchain data. Write queries, get instant feedback, earn certificates.
Explore WizardCamp